Every performance tool gives you a number, and the numbers rarely agree. A site can score 98 on one test, 62 on another, and feel perfectly fine to the person actually using it. Before optimising anything, it helps to know which number answers which question.
Four measurements worth knowing
- TTFB — how long the server takes to send the first byte. This is your hosting and your caching. Nothing else improves it.
- FCP — when something, anything, first appears. Mostly decided by render-blocking CSS.
- LCP — when the largest element of the first screen is drawn, usually a hero image or a headline. This is the one Google weighs most.
- CLS — how much the page jumps around while loading. Caused by images without dimensions, fonts swapping, banners inserted late.
A single score hides all four. Two sites with the same score can need completely different work.
Lab data and field data are not the same thing
Most tools run a lab test: one visit, from one place, on a simulated connection. It is reproducible, which makes it good for comparing before and after — and it says nothing about your actual visitors.
Field data comes from real visits, on real devices and real networks. It is what Google uses for ranking signals, and it moves slowly because it is an average over weeks. If your lab score improved yesterday, field data will show it in a month.
Measure your own site, both ways

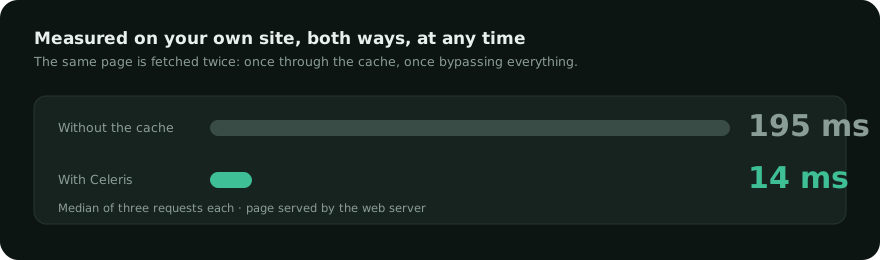
The most useful test is the one nobody runs: fetch the same page twice, once normally and once with everything bypassed, and compare. That removes the network, the location and the tool from the equation. Whatever is left is what your optimisation actually did.
Three rules to keep the comparison honest: measure while logged out, measure the same page, and take the median of several attempts rather than a single lucky one.
The order that actually works
- Server response. A page cache first, and check that it is really being served — many are installed but bypassed.
- Render-blocking CSS. Then, and only then, critical CSS.
- Images. Modern formats, explicit dimensions, loading on demand below the fold.
- Third-party scripts. Analytics, chat widgets, maps: deferred until after the page exists.
- Fonts. Self-hosted, preloaded, with a visible fallback while they arrive.
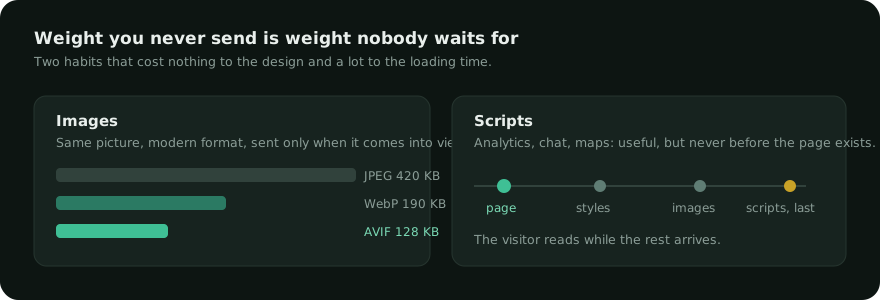
Working in this order matters more than the individual techniques. Optimising images on a site that answers in 800 ms is polishing the paint on a car with no engine.
When to stop
And if the admin is what feels slow rather than the public site, the problem is elsewhere: see what accumulates as a site grows. Chasing 100 out of 100 is a hobby, not a business objective. Under 200 ms of server response and under 2.5 seconds of LCP on mobile, your visitors have stopped noticing, and the next point costs more than it returns.
Celeris measures your own pages with and without the cache, from your admin, whenever you want — not just at installation.